Quando omni flunkus, mortati. Die dulci fruere.

| Subscribe via RSS

Showing posts with label javascript. Show all posts

Wednesday, August 26, 2009

Remove the Dotted Line/Title(parameter) in Cognos 8.4

| 0 comments

Need to remove the dotted line and title of a value prompt? Create an HTML Item in your report and fill it with the following Javascript:


<script>
var f = getFormWarpRequest();
var prompt = f._oLstChoicesX;
prompt.remove(1);
prompt.remove(0);
prompt.removeAttribute("hasLabel");
</script>

Where X is the name of the prompt specified in the properties. This tip works with Cognos 8.4. There are other Javascript methods for earlier versions.


Tuesday, June 9, 2009

A Tabbed Interface for Your Reports

| 2 comments

I wanted a way to show a series of reports within the context of the same window without using the dashboarding tools available from the Cognos interface. Here is a simple way in IBM Cognos 8.3 (using Javascript and an iframe) to create a tab-style interface which provides quick access for your reports:
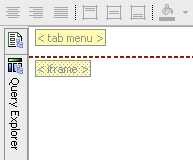
1. The first step is to create a new report – a shell report – which will be the main tab interface to your reports. In this new report, I've removed the header title block (but not the header) and added in two new HTML Items from the toolbox, one in the header area and the other in the body of the new report. I've given each a description (< tab menu > and < iframe >) using the Properties pane for easier reference.

2. The HTML Item referred to as < iframe > will house the iframe element. Open it and paste in the following:

<iframe name="content" src="http://localhost:80/cognos8/cgi-bin/cognosisapi.dll?b_action=cognosViewer&ui.action=run&ui.object=CAMID%28%22Local%20NT%20ID%3au%3dS-1-5-21-1004336348-688789844-682003330-1118%22%29%2ffolder%5b%40name%3d%27My%20Folders%27%5d%2freport%5b%40name%3d%27tabbed-revenue%27%5d&ui.name=tabbed-revenue&run.outputFormat=&run.prompt=true&cv.header=false" frameborder="0" height="500" width="100%"></iframe>
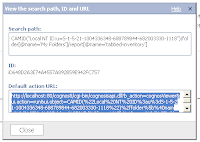
Notice that the src of the iframe is targeting the report path to my default report (this will be the report used on the first tab selection). You'll want to replace this with your own report path information (in Cognos Connection, open properties for the report. Click on the 'View the search path, ID and URL'. Copy the 'Default action URL' contents and paste it as the src to your iframe. Append the end of this string with '&cv.header=false' (this parameter hides the header of the report –the part that says 'Cognos Viewer', etc).

3. The HTML Item referred to as < tab menu > is the actual tabbed interface and contains three main parts: a Javascript function; some CSS style syntax; and some html tags. Open the HTML Item. Let's paste in the CSS style syntax:

<style type="text/css">
#demo-container{padding:25px 15px 0 15px;margin:0 0 15px 0;background:#c3d1e0;}

ul#simple-menu{list-style-type:none;width:100%;position:relative;height:27px;font-family:"Trebuchet MS",Arial,sans-serif;font-size:13px;font-weight:bold;margin:0;padding:11px 0 0 0;}

ul#simple-menu li{display:block;float:left;margin:0 0 0 4px;height:27px;}

ul#simple-menu li.left{margin:0;}

ul#simple-menu li a{display:block;float:left;color:#fff;background:#426695;line-height:27px;text-decoration:none;padding:0 17px 0 18px;height:27px;}

ul#simple-menu li a.right{padding-right:19px;}

ul#simple-menu li a:hover{background:#2E4560;}

ul#simple-menu li a.on{color:#2E4560;background:#fff;}

ul#simple-menu li a.on:hover{color:#2E4560;background:#fff;}

</style>


The CSS is responsible for the look of the tabbed interface (I've customized the colors with a bit of a Cognos 8.3 theme – change these colors as needed).

Now let's add the Javascript:

<script>

function putContent(n) {

var aLinks = document.getElementsByTagName("a");

for (i=0;i<aLinks.length;i++) {

if(aLinks[i].className == "on") {

aLinks[i].className = "off";

}


document.getElementById("link"+n).className = "on";

}

switch(n) {

case 2: document.getElementById("content").src = "http://localhost:80/cognos8/cgi-bin/cognosisapi.dll?b_action=cognosViewer&ui.action=run&ui=h1h2h3h4&ui.object=CAMID(%22Local%20NT%20ID%3au%3dS-1-5-21-1004336348-688789844-682003330-1118%22)%2ffolder%5b%40name%3d%27My%20Folders%27%5d%2freport%5b%40name%3d%27tabbed-margin%27%5d&ui.name=tabbed-margin&run.outputFormat=&run.prompt=true&cv.header=false"; break;

case 3: document.getElementById("content").src = "http://localhost:80/cognos8/cgi-bin/cognosisapi.dll?b_action=cognosViewer&ui.action=run&ui=h1h2h3h4&ui.object=CAMID(%22Local%20NT%20ID%3au%3dS-1-5-21-1004336348-688789844-682003330-1118%22)%2ffolder%5b%40name%3d%27My%20Folders%27%5d%2freport%5b%40name%3d%27tabbed-inventory%27%5d&ui.name=tabbed-inventory&run.outputFormat=&run.prompt=true&cv.header=false"; break;


default:document.getElementById("content").src = "http://localhost:80/cognos8/cgi-bin/cognosisapi.dll?b_action=cognosViewer&ui.action=run&ui=h1h2h3h4&ui.object=CAMID(%22Local%20NT%20ID%3au%3dS-1-5-21-1004336348-688789844-682003330-1118%22)%2ffolder%5b%40name%3d%27My%20Folders%27%5d%2freport%5b%40name%3d%27tabbed-revenue%27%5d&ui.name=tabbed-revenue&run.outputFormat=&run.prompt=true&cv.header=false";

}

}

</script>


And finally, let's add the HTML elements:

<div id="demo-container">

<ul id="simple-menu">

<li><a href="javascript:putContent(1);void(0);" title="Revenue" id="link1" class="on">Revenue</a></li>

<li><a href="javascript:putContent(2);void(0);" title="Margin" id="link2" class="off">Margin</a></li>

<li><a href="javascript:putContent(3);void(0);" title="Inventory" id="link3" class="off">Inventory</a></li>

</ul>

</div>


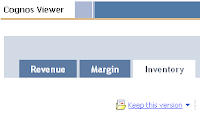
In this example, the tabbed report interface contains three tabs (Revenue, Margin and Inventory), but you could add as few or as many as you want (room permitting). Each tab element is actually an HTML un-ordered list item (referenced as &ltli>) which the CSS alters to make look like the tabbed menu interface. The <a href> tag within the list element contains some Javascript (ie javascript:putContent(1);void(0);") which calls a function in the Javascript code. The function 'putContent()' serves 2 purposes: First, it targets the iframe with a new source object, the URL (report path) of your report; and second, it changes the display of the tabs to show the most recent clicked tab (and sets the other tabs to their off-click states). The report paths are specified in the switch method (case 2: document.getElementById("content").src = "") and should be changed to match the report path of your own reports. Remember to add the '&cv.header=false' parameter. The final report tab interface should look something like this.

Thursday, March 19, 2009

Drop down lists: Customize label

| 0 comments

After creating a simple list in Report Studio you may want to create a drop down parametrized filter for it. First thing you'll notice when run the report is that the default selected text on the drop down is always set to the first field name of the list. I had requests to make this a little more representative, to something like 'Select field...' or 'Choose something...' which would give the user an indication that there were more choices available in the drop down.

To solve this issue, I found 2 techniques:

First is to create a static choice with the right correct display value for this prompt and set the default value to this static choice's value. Obviously this won't prevent the user from seeing the first line when he opens the drop down list.

The second technique would harness the following Javascript code. Drag a new html item into the report and include the following:

<script language="javascript">

var x = document.getElementsByTagName('select');

var RN_SelectClass = "clsSelectControl pv";

var is_Required;

for (var i=0;i 1) {
switch (x[i].options[0].text) {
case 'parameter1': x[i].options[0].text = 'NewLabel1'; break;
case 'parameter2': x[i].options[0].text = 'NewLabel2'; break;
default: x[i].options[0].text;
}
}
}
</script>


Next, change the parameter and NewLabel in the above syntax to suit your required label name conventions.

Sunday, November 23, 2008

Javascript technique: Tag cloud

| 0 comments

I was recently asked to build a quick view dashboard for the Sales team which contained a web 2.0 style tag cloud. What's a tag cloud? A tag cloud or word cloud (or weighted list in visual design) are usually single words and are typically listed alphabetically, and the importance of a tag is shown with font size or color.

Since Cognos 8 doesn't include such a widget, I utilized my peer network and was given this example which utilizes javascript. Here are the steps I followed to put it together (I'll use the standard demo data in Cognos called Go Sales):

Open a new Report Studio List report with the GO Sales package and populate it with [Staff Name] and [Revenue]. Next add [Order year] to the Query. Click the Filters button on the toolbar and create new filter:

[gosales_goretailers].[Orders].[Order year] = ?date?

Set it to Required. Drag a [Value Prompt] from the Toolbox (Insertable Objects) to left of your list so it appears on top. Set it to use the existing parameter ‘date’ and click Finish. In the properties for this prompt, set the Query to [Query1]. Set the Use Value to [Order year] and the Display Value to [Order year]. Create new Static Choices for this prompt. The new variable should be a string (call it anything) and add the use/display values 2003, 2004, 2005 and 2006 as below:


Next set the Properties to [Order year]. Set the Auto-Submit and Hide Adornments for this prompt to ‘Yes’. Finally, set the Default Selections to 2004 and change the width in the Size & Overflow to 75px.

From the Insertable Objects Toolbox drag an [HTML Item] to the right of the newly created Value Prompt. Add another [HTML Item] to the right of the List. Your page should look like this:


Open the top [HTML Item] and add the following:

<div id="cloud"></div><div id="dg" style="display:none">

Click OK. Open the second [HTML Item] (the one below the list) and add the following:

</div>

Click OK. Delete the contents of the page footer and add a new [HTML Item]. Open it and add the following modified open source code:

<textarea readonly="" cols="40" rows="20" id="cloudhtml" style="display:none;"></textarea>
<script>
// ====================================
// params that might need changin.
// DON'T forget to include a drill url in the href section below (see ###) if you want this report to be drillable
var delimit = "|";
var subdelimit = "[]"; // change this as needed (ex: Smith, Michael[]$500,000.00|)
var labelColumnNumber = 0; // first column is 0
var valueColumnNumber = 1;
var columnCount = 2; // how many columns are there in the list?
// ====================================

function formatCurrency(num) {
num = num.toString().replace(/\$|\,/g,'');
if(isNaN(num))
num = "0";
sign = (num == (num = Math.abs(num)));
num = Math.floor(num*100+0.50000000001);
cents = num%100;
num = Math.floor(num/100).toString();
if(cents<10)
cents = "0" + cents;
for (var i = 0; i < Math.floor((num.length-(1+i))/3); i++)
num = num.substring(0,num.length-(4*i+3))+','+ num.substring(num.length-(4*i+3));
return (((sign)?'':'-') + '$' + num + '.' + cents);
}

function filterNum(str) {
re = /\$|,|@|#|~|`|\%|\*|\^|\&|\(|\)|\+|\=|\[|\-|\_|\]|\[|\}|\{|\;|\:|\'|\"|\<|\>|\?|\||\\|\!|\$|/g;
// remove special characters like "$" and "," etc...
return str.replace(re, "");
}

tags = document.getElementById("dg").getElementsByTagName("SPAN");
txt = "";
for (var i=columnCount; i<tags.length; i++) {
valu = filterNum(tags[i+valueColumnNumber].innerHTML);
txt += valu;
txt += subdelimit+tags[i+labelColumnNumber].innerHTML+delimit;
i = i+columnCount;
}

function getFontSize(min,max,val) {
return Math.round((150.0*(1.0+(1.5*val-max/2)/max)));
}

function generateCloud(txt) {
//var txt = "48.1,Google|28.1,Yahoo!|10.5,Live/MSN|4.9,Ask|5,AOL";
var logarithmic = false;
var lines = txt.split(delimit);
var min = 10000000000;
var max = 0;
for(var i=0;i<lines.length;i++) {
var line = lines[i];
var data = line.split(subdelimit);
if(data.length != 2) {
lines.splice(i,1);
continue;
}
data[0] = parseFloat(data[0]);
lines[i] = data;
if(data[0] > max)
max = data[0];
if(data[0] < min)
min = data[0];
}lines.sort(function (a,b) {
var A = a[1].toLowerCase();
var B = b[1].toLowerCase();
return A>B ? 1 : (A<B ? -1 : 0);
});

var html = "<style type='text/css'>#jscloud a:hover { text-decoration: underline; }</style> <div id='jscloud'>";
if(logarithmic) {
max = Math.log(max);
min = Math.log(min);
}
for(var i=0;i<lines.length;i++) {
var val = lines[i][0];
if(logarithmic) val = Math.log(val);
var fsize = getFontSize(min,max,val);
dollar = formatCurrency(lines[i][0]);
html += " <a href='###Some drillthrough url which includes the param "+lines[i][1]+"' style='font-size:"+fsize+"%;' title='"+dollar+"'>"+lines[i][1]+"</a> ";
}
html += "</div>";
var cloud = document.getElementById("cloud");
cloud.innerHTML = html;
var cloudhtml = document.getElementById("cloudhtml");
cloudhtml.value = html;
}
function setClass(layer,cls) {
layer.setAttribute("class",cls);
layer.setAttribute("className",cls);
}
function show(display) {
var cloud = document.getElementById("cloud");
var cloudhtml = document.getElementById("cloudhtml");if(display == "cloud") {
setClass(cloud,"visible");
setClass(cloudhtml,"hidden");
}
else if(display == "html") {
setClass(cloud,"hidden");
setClass(cloudhtml,"visible");
}
}
generateCloud(txt);
</script>


Click OK, run the report. Roll over the individual Sales rep to see the actual revenue in the flyout. You can now customize this for your needs and add it as a Cognos Viewer portlet to a Cognos portal page or your preferred portal.