I wanted a way to show a series of reports within the context of the same window without using the dashboarding tools available from the Cognos interface. Here is a simple way in IBM Cognos 8.3 (using Javascript and an iframe) to create a tab-style interface which provides quick access for your reports:
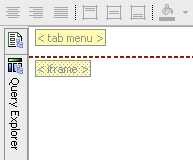
1. The first step is to create a new report – a shell report – which will be the main tab interface to your reports. In this new report, I've removed the header title block (but not the header) and added in two new HTML Items from the toolbox, one in the header area and the other in the body of the new report. I've given each a description (< tab menu > and < iframe >) using the Properties pane for easier reference.
2. The HTML Item referred to as < iframe > will house the iframe element. Open it and paste in the following:
<iframe name="content" src="http://localhost:80/cognos8/cgi-bin/cognosisapi.dll?b_action=cognosViewer&ui.action=run&ui.object=CAMID%28%22Local%20NT%20ID%3au%3dS-1-5-21-1004336348-688789844-682003330-1118%22%29%2ffolder%5b%40name%3d%27My%20Folders%27%5d%2freport%5b%40name%3d%27tabbed-revenue%27%5d&ui.name=tabbed-revenue&run.outputFormat=&run.prompt=true&cv.header=false" frameborder="0" height="500" width="100%"></iframe>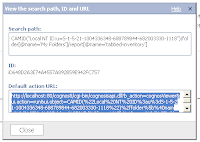
Notice that the src of the iframe is targeting the report path to my default report (this will be the report used on the first tab selection). You'll want to replace this with your own report path information (in Cognos Connection, open properties for the report. Click on the 'View the search path, ID and URL'. Copy the 'Default action URL' contents and paste it as the src to your iframe. Append the end of this string with '&cv.header=false' (this parameter hides the header of the report –the part that says 'Cognos Viewer', etc).
3. The HTML Item referred to as < tab menu > is the actual tabbed interface and contains three main parts: a Javascript function; some CSS style syntax; and some html tags. Open the HTML Item. Let's paste in the CSS style syntax:
<style type="text/css">
#demo-container{padding:25px 15px 0 15px;margin:0 0 15px 0;background:#c3d1e0;}
ul#simple-menu{list-style-type:none;width:100%;position:relative;height:27px;font-family:"Trebuchet MS",Arial,sans-serif;font-size:13px;font-weight:bold;margin:0;padding:11px 0 0 0;}
ul#simple-menu li{display:block;float:left;margin:0 0 0 4px;height:27px;}
ul#simple-menu li.left{margin:0;}
ul#simple-menu li a{display:block;float:left;color:#fff;background:#426695;line-height:27px;text-decoration:none;padding:0 17px 0 18px;height:27px;}
ul#simple-menu li a.right{padding-right:19px;}
ul#simple-menu li a:hover{background:#2E4560;}
ul#simple-menu li a.on{color:#2E4560;background:#fff;}
ul#simple-menu li a.on:hover{color:#2E4560;background:#fff;}
</style>The CSS is responsible for the look of the tabbed interface (I've customized the colors with a bit of a Cognos 8.3 theme – change these colors as needed).
Now let's add the Javascript:
<script>
function putContent(n) {
var aLinks = document.getElementsByTagName("a");
for (i=0;i<aLinks.length;i++) {
if(aLinks[i].className == "on") {
aLinks[i].className = "off";
}
document.getElementById("link"+n).className = "on";
}
switch(n) {
case 2: document.getElementById("content").src = "http://localhost:80/cognos8/cgi-bin/cognosisapi.dll?b_action=cognosViewer&ui.action=run&ui=h1h2h3h4&ui.object=CAMID(%22Local%20NT%20ID%3au%3dS-1-5-21-1004336348-688789844-682003330-1118%22)%2ffolder%5b%40name%3d%27My%20Folders%27%5d%2freport%5b%40name%3d%27tabbed-margin%27%5d&ui.name=tabbed-margin&run.outputFormat=&run.prompt=true&cv.header=false"; break;
case 3: document.getElementById("content").src = "http://localhost:80/cognos8/cgi-bin/cognosisapi.dll?b_action=cognosViewer&ui.action=run&ui=h1h2h3h4&ui.object=CAMID(%22Local%20NT%20ID%3au%3dS-1-5-21-1004336348-688789844-682003330-1118%22)%2ffolder%5b%40name%3d%27My%20Folders%27%5d%2freport%5b%40name%3d%27tabbed-inventory%27%5d&ui.name=tabbed-inventory&run.outputFormat=&run.prompt=true&cv.header=false"; break;
default:document.getElementById("content").src = "http://localhost:80/cognos8/cgi-bin/cognosisapi.dll?b_action=cognosViewer&ui.action=run&ui=h1h2h3h4&ui.object=CAMID(%22Local%20NT%20ID%3au%3dS-1-5-21-1004336348-688789844-682003330-1118%22)%2ffolder%5b%40name%3d%27My%20Folders%27%5d%2freport%5b%40name%3d%27tabbed-revenue%27%5d&ui.name=tabbed-revenue&run.outputFormat=&run.prompt=true&cv.header=false";
}
}
</script>And finally, let's add the HTML elements:
<div id="demo-container">
<ul id="simple-menu">
<li><a href="javascript:putContent(1);void(0);" title="Revenue" id="link1" class="on">Revenue</a></li>
<li><a href="javascript:putContent(2);void(0);" title="Margin" id="link2" class="off">Margin</a></li>
<li><a href="javascript:putContent(3);void(0);" title="Inventory" id="link3" class="off">Inventory</a></li>
</ul>
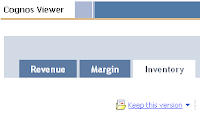
</div>In this example, the tabbed report interface contains three tabs (Revenue, Margin and Inventory), but you could add as few or as many as you want (room permitting). Each tab element is actually an HTML un-ordered list item (referenced as <li>) which the CSS alters to make look like the tabbed menu interface. The <a href> tag within the list element contains some Javascript (ie javascript:putContent(1);void(0);") which calls a function in the Javascript code. The function 'putContent()' serves 2 purposes: First, it targets the iframe with a new source object, the URL (report path) of your report; and second, it changes the display of the tabs to show the most recent clicked tab
(and sets the other tabs to their off-click states). The report paths are specified in the switch method (
case 2: document.getElementById("content").src = "") and should be changed to match the report path of your own reports. Remember to add the '&cv.header=false' parameter. The final report tab interface should look something like this.