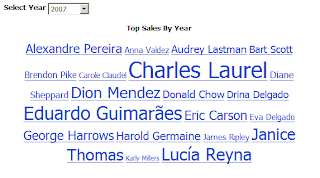
 I was recently asked to build a quick view dashboard for the Sales team which contained a web 2.0 style tag cloud. What's a tag cloud? A tag cloud or word cloud (or weighted list in visual design) are usually single words and are typically listed alphabetically, and the importance of a tag is shown with font size or color.
Since Cognos 8 doesn't include such a widget, I utilized my peer network and was given this example which utilizes javascript. Here are the steps I followed to put it together (I'll use the standard demo data in Cognos called Go Sales):
Open a new Report Studio List report with the GO Sales package and populate it with [Staff Name] and [Revenue]. Next add [Order year] to the Query. Click the Filters button on the toolbar and create new filter:
[gosales_goretailers].[Orders].[Order year] = ?date?
Set it to Required. Drag a [Value Prompt] from the Toolbox (Insertable Objects) to left of your list so it appears on top. Set it to use the existing parameter ‘date’ and click Finish. In the properties for this prompt, set the Query to [Query1]. Set the Use Value to [Order year] and the Display Value to [Order year]. Create new Static Choices for this prompt. The new variable should be a string (call it anything) and add the use/display values 2003, 2004, 2005 and 2006 as below:

Next set the Properties to [Order year]. Set the Auto-Submit and Hide Adornments for this prompt to ‘Yes’. Finally, set the Default Selections to 2004 and change the width in the Size & Overflow to 75px.
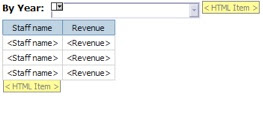
From the Insertable Objects Toolbox drag an [HTML Item] to the right of the newly created Value Prompt. Add another [HTML Item] to the right of the List. Your page should look like this:

Open the top [HTML Item] and add the following:
<div id="cloud"></div><div id="dg" style="display:none">
Click OK. Open the second [HTML Item] (the one below the list) and add the following:
</div>
Click OK. Delete the contents of the page footer and add a new [HTML Item]. Open it and add the following modified open source code:
<textarea readonly="" cols="40" rows="20" id="cloudhtml" style="display:none;"></textarea>
<script>
// ====================================
// params that might need changin.
// DON'T forget to include a drill url in the href section below (see ###) if you want this report to be drillable
var delimit = "|";
var subdelimit = "[]"; // change this as needed (ex: Smith, Michael[]$500,000.00|)
var labelColumnNumber = 0; // first column is 0
var valueColumnNumber = 1;
var columnCount = 2; // how many columns are there in the list?
// ====================================
function formatCurrency(num) {
num = num.toString().replace(/\$|\,/g,'');
if(isNaN(num))
num = "0";
sign = (num == (num = Math.abs(num)));
num = Math.floor(num*100+0.50000000001);
cents = num%100;
num = Math.floor(num/100).toString();
if(cents<10)
cents = "0" + cents;
for (var i = 0; i < Math.floor((num.length-(1+i))/3); i++)
num = num.substring(0,num.length-(4*i+3))+','+ num.substring(num.length-(4*i+3));
return (((sign)?'':'-') + '$' + num + '.' + cents);
}
function filterNum(str) {
re = /\$|,|@|#|~|`|\%|\*|\^|\&|\(|\)|\+|\=|\[|\-|\_|\]|\[|\}|\{|\;|\:|\'|\"|\<|\>|\?|\||\\|\!|\$|/g;
// remove special characters like "$" and "," etc...
return str.replace(re, "");
}
tags = document.getElementById("dg").getElementsByTagName("SPAN");
txt = "";
for (var i=columnCount; i<tags.length; i++) {
valu = filterNum(tags[i+valueColumnNumber].innerHTML);
txt += valu;
txt += subdelimit+tags[i+labelColumnNumber].innerHTML+delimit;
i = i+columnCount;
}
function getFontSize(min,max,val) {
return Math.round((150.0*(1.0+(1.5*val-max/2)/max)));
}
function generateCloud(txt) {
//var txt = "48.1,Google|28.1,Yahoo!|10.5,Live/MSN|4.9,Ask|5,AOL";
var logarithmic = false;
var lines = txt.split(delimit);
var min = 10000000000;
var max = 0;
for(var i=0;i<lines.length;i++) {
var line = lines[i];
var data = line.split(subdelimit);
if(data.length != 2) {
lines.splice(i,1);
continue;
}
data[0] = parseFloat(data[0]);
lines[i] = data;
if(data[0] > max)
max = data[0];
if(data[0] < min)
min = data[0];
}lines.sort(function (a,b) {
var A = a[1].toLowerCase();
var B = b[1].toLowerCase();
return A>B ? 1 : (A<B ? -1 : 0);
});
var html = "<style type='text/css'>#jscloud a:hover { text-decoration: underline; }</style> <div id='jscloud'>";
if(logarithmic) {
max = Math.log(max);
min = Math.log(min);
}
for(var i=0;i<lines.length;i++) {
var val = lines[i][0];
if(logarithmic) val = Math.log(val);
var fsize = getFontSize(min,max,val);
dollar = formatCurrency(lines[i][0]);
html += " <a href='###Some drillthrough url which includes the param "+lines[i][1]+"' style='font-size:"+fsize+"%;' title='"+dollar+"'>"+lines[i][1]+"</a> ";
}
html += "</div>";
var cloud = document.getElementById("cloud");
cloud.innerHTML = html;
var cloudhtml = document.getElementById("cloudhtml");
cloudhtml.value = html;
}
function setClass(layer,cls) {
layer.setAttribute("class",cls);
layer.setAttribute("className",cls);
}
function show(display) {
var cloud = document.getElementById("cloud");
var cloudhtml = document.getElementById("cloudhtml");if(display == "cloud") {
setClass(cloud,"visible");
setClass(cloudhtml,"hidden");
}
else if(display == "html") {
setClass(cloud,"hidden");
setClass(cloudhtml,"visible");
}
}
generateCloud(txt);
</script>
Click OK, run the report. Roll over the individual Sales rep to see the actual revenue in the flyout. You can now customize this for your needs and add it as a Cognos Viewer portlet to a Cognos portal page or your preferred portal.

